Americans’ satisfaction with the numerical level of immigration into the United States has dropped six percentage points over the past year, according to a recent poll from Gallup. In January 2022, 34% of Americans approved of the number of immigrants entering the U.S., compared to just 28% satisfaction in Jan. 2023.
This represents the lowest satisfaction with immigration levels in a decade, but not the least satisfied Americans have been on the issue since the turn of the millennium. “U.S. public satisfaction with immigration was scarcest in 2007 and 2008, at 23% and 24%, respectively, whereas it reached 40%-41% at its highest, in 2017 and 2018,” reports Gallup.
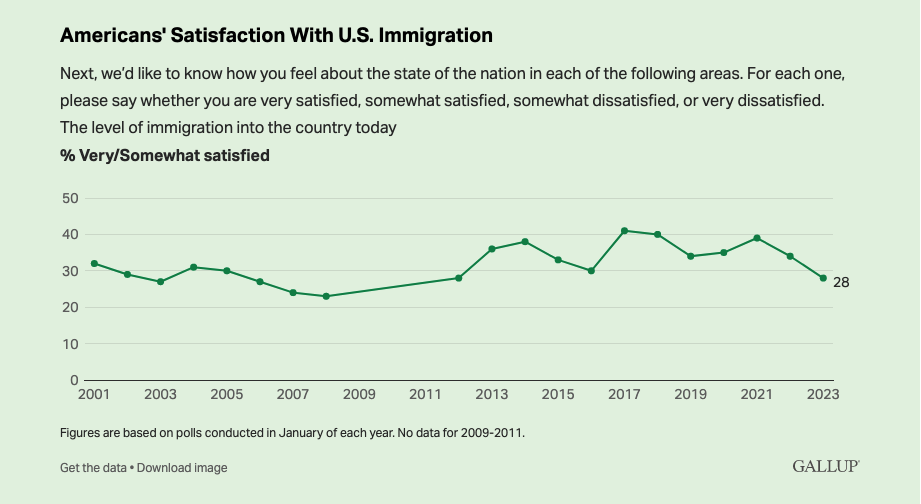
Each Jan., Gallup measures the satisfaction expressed by Americans with the level of U.S. immigration along with several other issues as part of its annual ‘Mood of the Nation’ survey. Between 2001 and 2016, immigration has consistently ranked near the bottom of the surveyed satisfaction levels; since 2016, immigration has ranked slightly higher but has remained in the bottom half of issues.
Gallup reported:
In the latest poll, conducted Jan. 2-22, satisfaction with immigration is on par with the quality of public education (29% satisfied) and policies to reduce or control crime (27%) but ahead of efforts to address poverty (15%) and the nation’s campaign finance laws (14%).
The recent shift in U.S. attitudes no doubt reflects the situation at the Southern border, where the U.S. government reported a fourfold annual increase in migrants attempting to [illegally] enter the U.S. in 2021, with the figure rising to 1.7 million. More than 2 million such migrant encounters occurred in 2022.
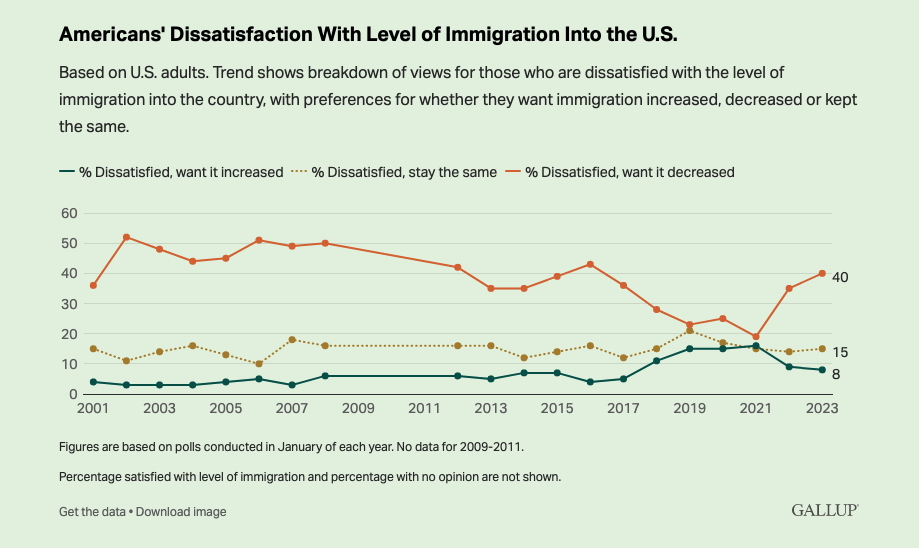
Obviously, the flip side of 28% of Americans satisfied with U.S. immigration levels is 63% of Americans dissatisfied with the number of migrants entering the U.S. either legally or illegally.
A follow-up survey question found that a desire for less overall immigration is what’s driving the aforementioned dissatisfaction among Americans, with 64% of survey respondents saying they want immigration decreased. Conversely, just 8% are dissatisfied because they want more immigration, and 15% are dissatisfied but want immigration levels to remain the same.
“The percentage who are dissatisfied out of a desire for less immigration has risen sharply over the past two years, increasing from 19% in 2021 to 35% in 2022 and 40% today,” reads the Gallup report.
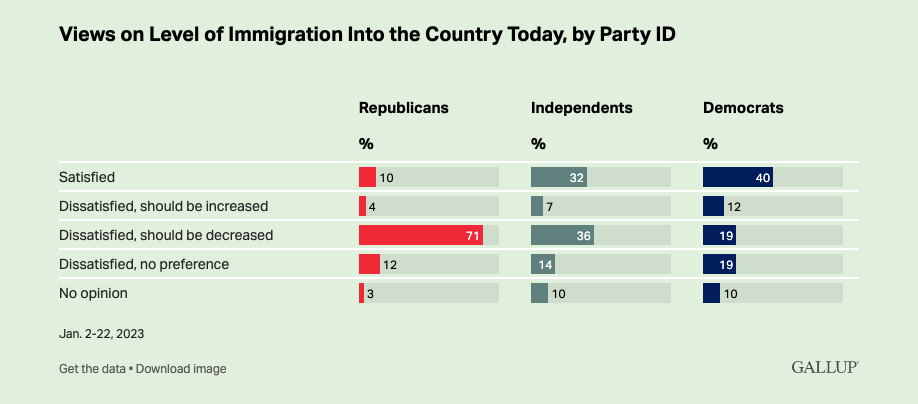
The desire to decrease immigration levels into the U.S. has increased across all political parties since 2021 but still remains more common among Republicans than either Independents or Democrats.
According to Gallup,
- The percentage of Republicans dissatisfied with immigration levels for being too high jumped from 40% in 2021 to 69% in 2022 and remains about the same today, at 71%.
- The percentage of Democrats dissatisfied and desiring less immigration was nearly nonexistent in 2021, at 2%, before rising to 11% last year and 19% now.
- Independents’ dissatisfaction and preference for less immigration has about doubled since 2021, rising from 19% at that time to 36% today.
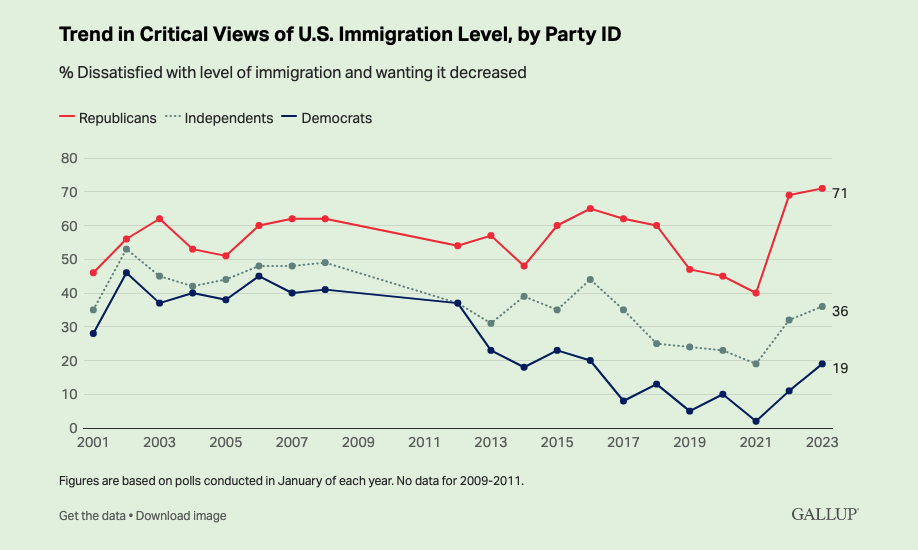
Republicans’ displeasure with immigration for being too high is now the highest Gallup has recorded for that party.
You can read the complete story here.
Related Resources
 Videos
 November 3, 2023

 Factsheets
November 4, 2023


 Facebook
 LinkedIn
 Tweet
Tweet
 Email
Email
 Print
Print
 Articles